Background
The US election is rapidly approaching, and investors are trying to position themselves by using alternative data. Some people argue that it is futile to try and position your portfolio based on the potential outcome of an election. The chart below shows that the buy and hold market index has worked historically. In recent years only the Bush administration saw negative returns, which was driven by the financial crises. However, within the Bush term, Oil companies and Defence stocks outperformed the averages. Similarly, during the Obama years, consumer discretionary stocks returned 338% while energy stocks returned just 53%. Sectors and stocks matter and alt data can help formulate a view of election outcomes.
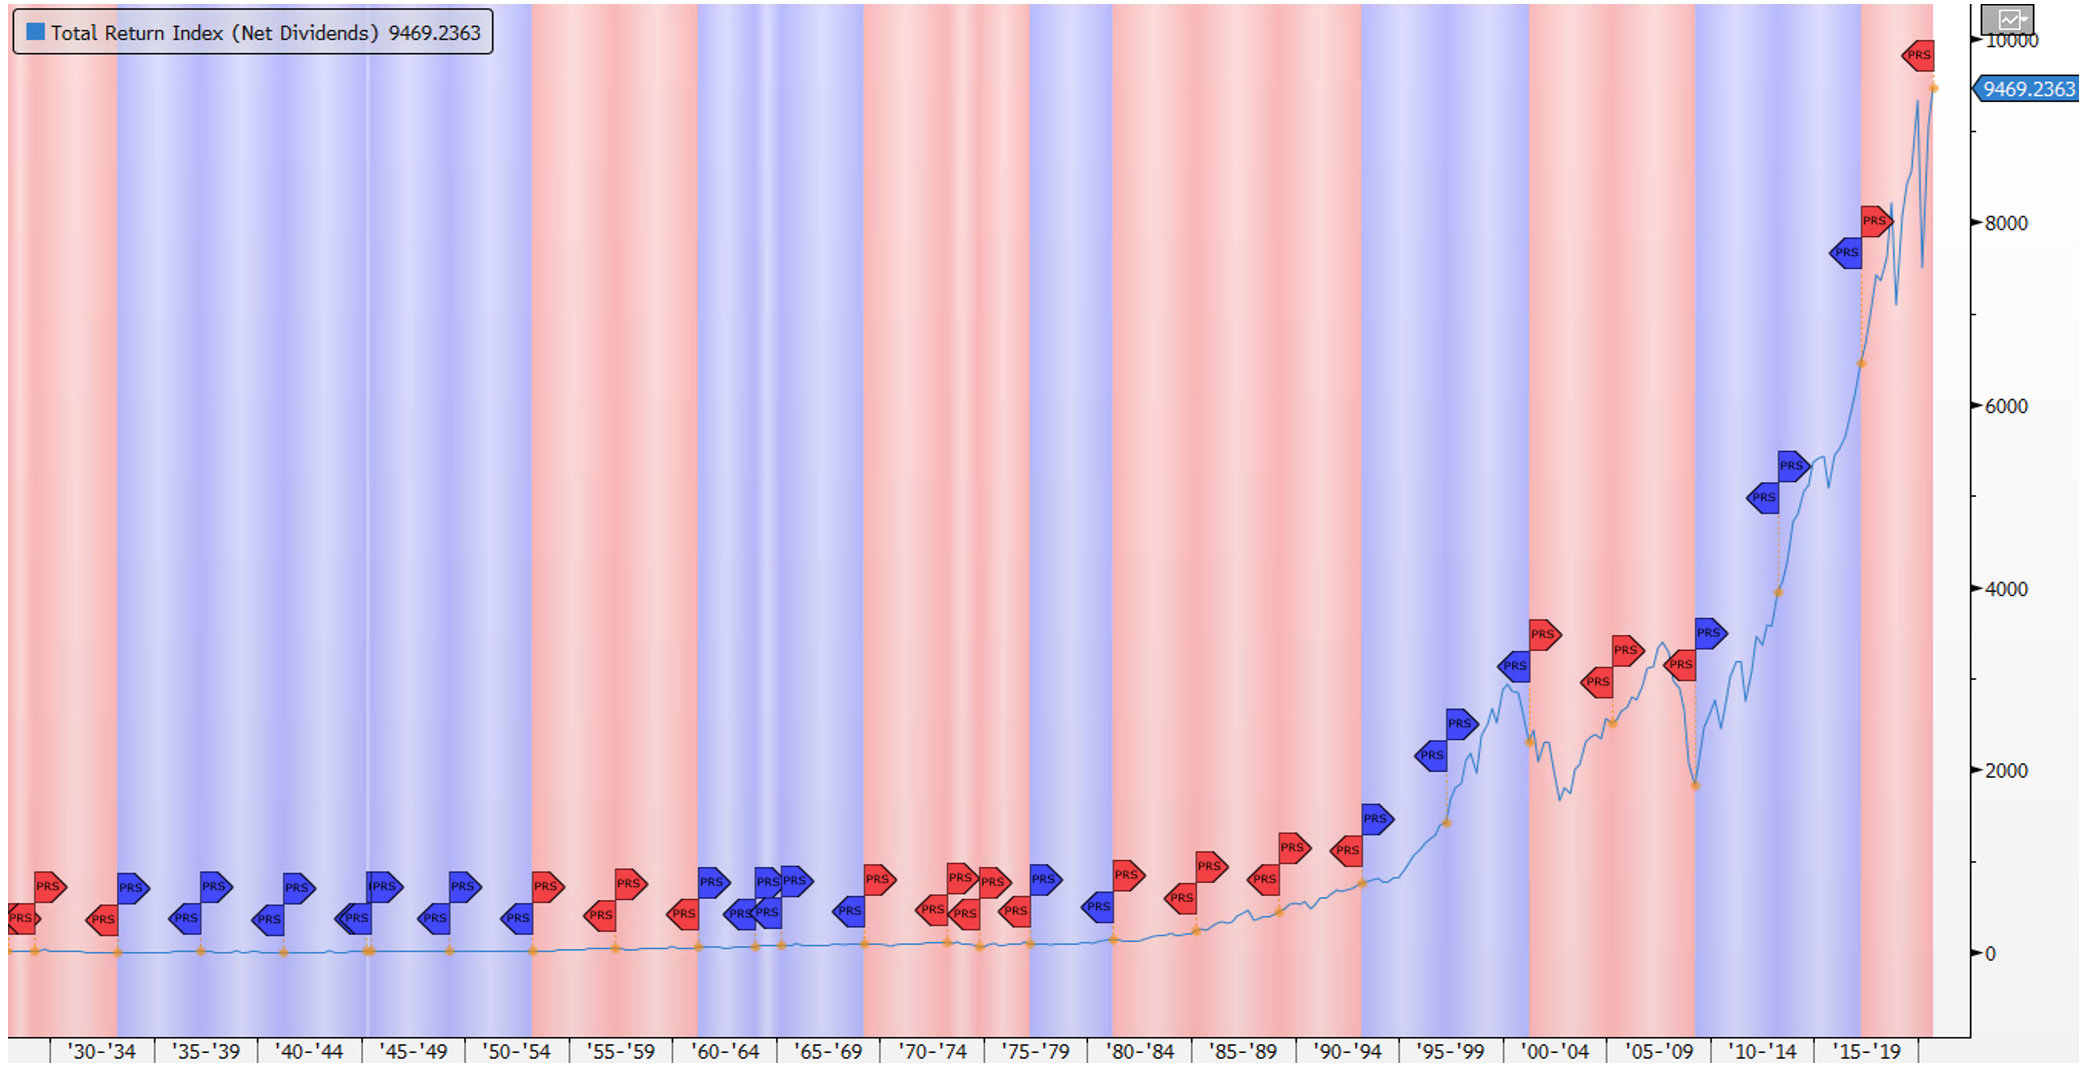
Figure 1: S&P 500 Total Returns from 1930.
Sources of Election Data
The most commonly used election data fall into two related categories of polling & survey data and sentiment & consumer confidence data. Polling and survey data can be conducted online or offline. Using these data sources some vendors use advanced NLP and ML techniques to ascertain consumer sentiment around candidates and political issues. Betting odds data is also a common source of data that can be used to compliment polling and sentiment data. The heath of the economy can be used as a predictor of elections and consumer spending data along with inflation can be used to model expectations. In a recent Expert Hub post, Prof. Sudip Gupta made some other suggestions, such as Federal Election Commission data on political contributions and political speech textual analysis. Sudip referenced some academic papers that demonstrated how certain stocks and sectors can outperform based on election outcomes.
Commonly Used Data
We recently published a use case deck of the common forms of election data. The focus of the use case deck was polling/survey data, sentiment data and betting odds data. Some examples of the data are shown below.
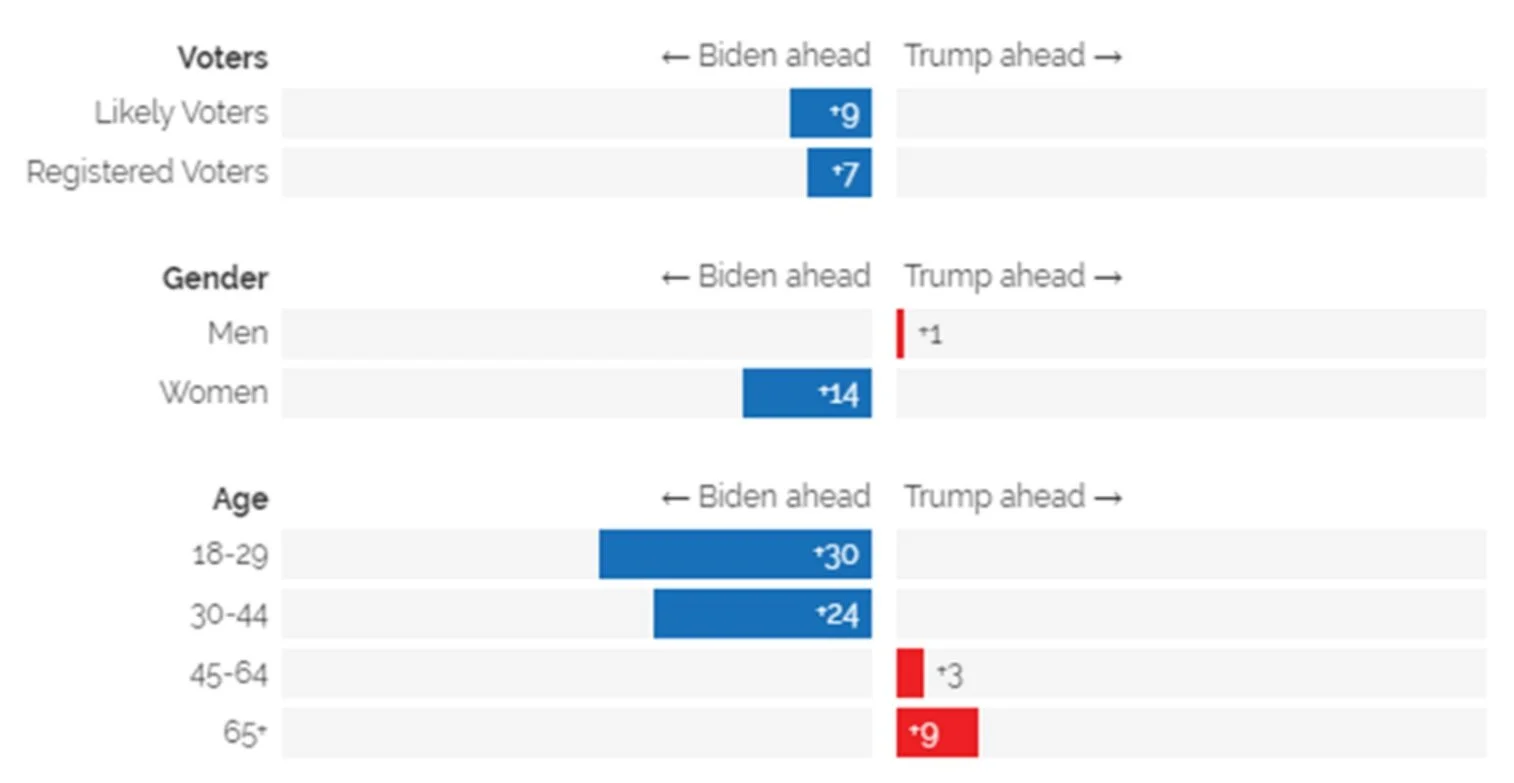
Figure 2: Expected Voter Behavior – Demographics.
One example of polling data is shown on the right. This shows the expected voting behaviour of the types of voters by gender and age bracket. A more granular view of the data can be used to model results.

Figure 3: Betting Odds Over Time.
Betting odds data has become widely used in recent years. Betting data is thought to be better than survey data as it is a reflection of people putting money on the table, rather than just opinion. However, like polling data, the results have been mixed in recent elections in the US and Europe.

Figure 4: “Vote Biden” Sentiment- Florida.
Sentiment and consumer confidence around issues and candidates can also be important. Sentiment can look at voting blocks, by important issues and by the candidate. Using Eagle Alpha’s Brandwatch tool we show in Chart 4 the sentiment for “Vote Biden” just in the state of Florida, a key swing state.
[Data Strategy clients can click here to access all available case studies]
At our September virtual conference, there was a panel discussion on the topic of Will Trump Get Re-Elected. The panel consisted of three data vendors and one economic and political commentator. The data vendors consisted of polling data, sentiment data and a political science generated dataset. The polling data vendor expects a Trump victory while the other two vendors predict a Biden victory. The panellists noted that the uncertainly in the data, and the outcome of the election, may lead to political, economic and stock market risks in the months up to and after the election.
[Data Strategy clients can click here to access content from all three days of our September virtual conference]
Things To Be Aware Of
There are numerous election datasets and many academic studies on the topic. However, as highlighted by Evan Schnidman in a recent Expert Hub comment, there are risks in using election data in an investment process. Evan noted that there are dozens of datasets that are correlated to election results but “most historical correlations are spurious, not causal”. One needs to be careful of single-issue topics that arise in different election cycles. Referencing the US election Evan suggests using robust demographic data in conjunction with indicators of the economy in general, and at the state or regional level, to judge where voters are likely to cast their ballot.
Legal Considerations
There have been some contentious elections in the UK in recent years and there has been some noise around legislation on election data, particularly as it pertains to financial markets and trading on exit poll data. Legal barriers are unlikely in the near term, but Lowenstein Sandler did comment that the buy-side “must continue to diligence the source of election data to ensure that it is lawfully obtained”.
[Data Strategy clients can click here to access the archive of legal workshops and click here to access our archive of legal articles.]
Conclusion
Buy and hold strategies for the broader market may not be influenced by elections, but sectors and stocks can be impacted by changes in governments. Alternative data can be used to ascertain likely election outcomes and there are many sources of such data. Survey and sentiment data are commonly used but investors need a heightened awareness of causality and spurious correlations in such data. Legally, there are no barriers to deploying election data in an investment process, but investors do need to perform relevant due diligence on data provenance.
[If you would like to learn more about any of the data sources mentioned or how Eagle Alpha is helping clients in the current environment then please contact us at inquiries@eaglealpha.com]